West Byfleet Infant School
Performance
Raising attainment for all children is a core priority in our school, driven by high expectations, quality teaching, and a deep understanding of each child’s individual needs. We believe that every child is capable of achieving success, and we are committed to providing the support, challenge, and opportunities needed to help them reach their full potential.
WEST BYFLEET INFANT SCHOOL (WBIS) ATTAINMENT RESULTS ARE AS FOLLOWS:
EYFS – 90 pupils
|
% |
2025 National
|
2025 WBIS |
2024 WBIS |
2023 National |
2023 WBIS |
|
Reading |
76% | 74% | 77% | 76% | 81% |
|
Writing |
72% | 72% | 74% | 71% | 74% |
|
Maths |
79% | 75% | 76% | 77% | 84% |
|
GLD |
68% | 69% | 76% | 67% | 65% |
Phonics Screening – 90 pupils
|
% met standard |
2025 National | 2025 WBIS | 2024 National |
2024 WBIS |
2023 National |
2023 WBIS |
|
Year 1 (90 pupils) |
80% | 78% | 80% | 85% | 79% | 87% |
|
Year 2 Retakes |
89% | 89% | 91% | 68% | 89% | 91% |
KS1 (Year 2) - Teacher Assessment - 90 pupils
|
% meeting age related expectations (ARE) or above |
2025 WBIS |
2024 WBIS |
2023 WBIS |
|
Reading |
80% | 75% | 73% |
|
Writing |
67% | 69% | 66% |
|
Maths |
79% | 79% | 72% |
Inclusion Register 2025-2026
|
Code of Practice |
R |
Yr 1 |
Yr 2 |
Total |
|
SEN Support |
13 |
12 |
12 |
37 (14%) |
|
EHCP |
0 |
4 |
3 |
7 (3%)
|
|
Totals |
13 |
16 |
15 |
44 (17%) |
DfE School Performance Tables
You may see the DfE School Performance Tables at this website.
You may see comparative data at the school and college performance tables at this website.
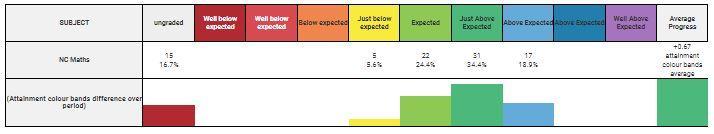
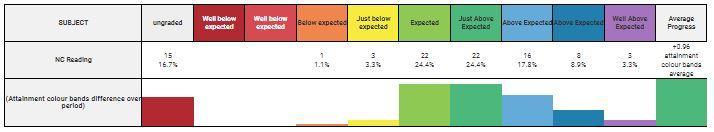
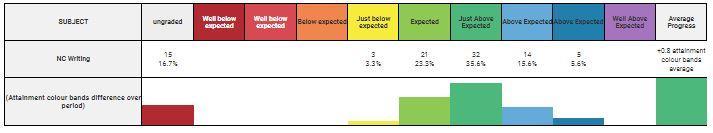
KS1 Progress Over Time